

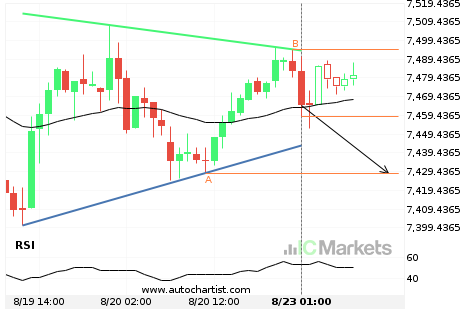
Should we expect a breakout or a rebound on FTSE China A50 Index?
The movement of FTSE China A50 Index towards the resistance line of a Triangle is yet another test of the line it reached numerous times in the past. We expect this line test to happen in the next 6 hours, but it is uncertain whether it will result in a breakout through this line, or […]
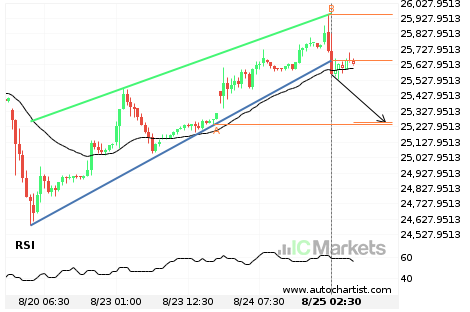
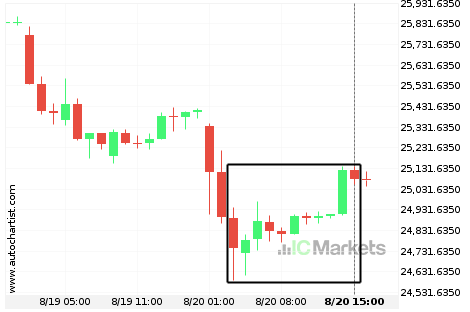
A start of a bearish trend on Hong Kong 50 Index
Hong Kong 50 Index has broken through a support line of a Rising Wedge chart pattern. If this breakout holds true, we expect the price of Hong Kong 50 Index to test 25256.0284 within the next 10 hours. But don’t be so quick to trade, it has tested this line in the past, so you […]
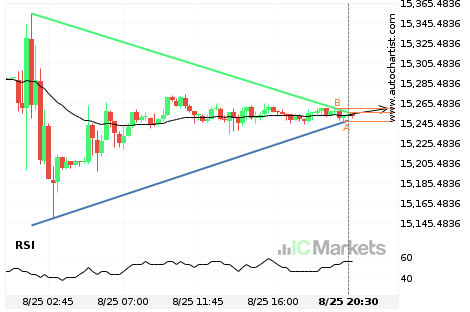
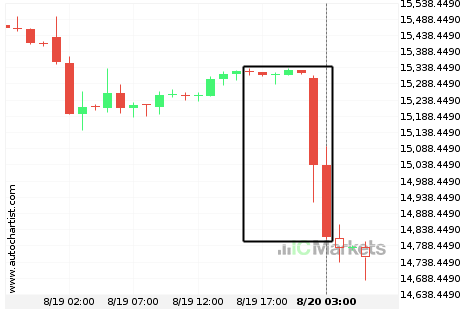
Either a rebound or a breakout imminent on FTSE China A50 Index
FTSE China A50 Index is heading towards a line of 15647.6201. If this movement continues, we expect the price of FTSE China A50 Index to test 15647.6201 within the next 3 days. But don’t be so quick to trade, it has tested this line numerous times in the past, so this movement could be short-lived […]

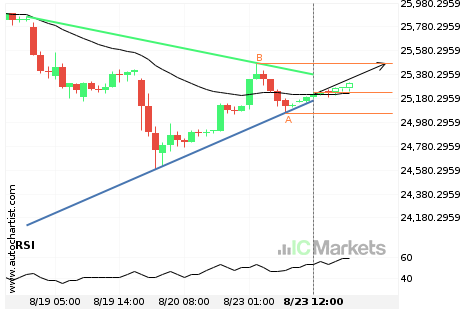
Either a rebound or a breakout imminent on Hong Kong 50 Index
Hong Kong 50 Index is heading towards the resistance line of a Triangle. If this movement continues, we expect the price of Hong Kong 50 Index to test 25476.3000 within the next 8 hours. But don’t be so quick to trade, it has tested this line numerous times in the past, so this movement could […]
Will Australia 200 Index have enough momentum to break support?
Australia 200 Index is heading towards the support line of a Triangle and could reach this point within the next 5 hours. It has tested this line numerous times in the past, and this time could be no different from the past, ending in a rebound instead of a breakout. If the breakout doesn’t happen, […]

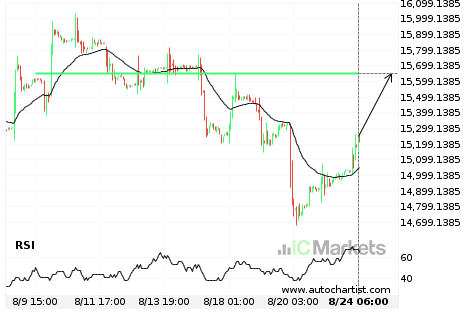
Where is Hong Kong 50 Index moving to?
A movement of 1.35% over 12 hours on Hong Kong 50 Index doesn’t go unnoticed. You may start considering where it’s heading next, a continuation of the current upward trend, or a reversal in the previous direction.
Where is Hong Kong 50 Index moving to?
A movement of 1.35% over 12 hours on Hong Kong 50 Index doesn’t go unnoticed. You may start considering where it’s heading next, a continuation of the current upward trend, or a reversal in the previous direction.
What’s going on with FTSE China A50 Index?
Those of you that are trend followers are probably eagerly watching FTSE China A50 Index to see if its latest 3.33% move continues. If not, the mean-reversion people out there will be delighted to cash in on this exceptionally large 11 hours move.